This is a company whose IPO I am interested in buying once it starts trading on Thursday (12/10). I use the normal template I have for growth stocks to analyze Airbnb’s S-1 form.
I try to summarize as concise as possible so it will be fast to read through and have a quick idea on the whole picture of the company.
All data, graphs and quotations used in this post are sourced from Airbnb S-1. S-1 form is a gold mine for acquiring company information with tons of details.
1. Background
Airbnb was initially founded by two designers to solve a room shortage during a design conference. Their initial goal was to connect hosts who look to meet new people by short renting their space with guests who look for unique and engaging experience during their travels. After thirteen years, Airbnb has become a global platform that features one-of-a-kind travel for any type of stays: domestic, international, short-distance, temporary housing, holiday housing, etc. With footprints over 220 countries and connecting over 825 millions guests, Airbnb truly becomes a distinct company in the travel industry.
1.1 Products
Airbnb provides a platform through online website and mobile app. It provides listing of hosts’ properties, assisting hosts set reasonable pricing based on past collected stay data, scheduling of available time slots of properties, payments from guests and processing payment to hosts, and community supports. It also provides a Superhost program which recognizes most active and high-quality hosts. Superhosts typically have higher occupancy rates due to the guests value they offer.
The core innovation of Airbnb is its trust system that is built from two way reviews and feedbacks from hosts and guests through each stay:
Our System of Trust
One of our core innovations has been the design of a system that allows millions of strangers to trust one another. The system for trust that we have designed includes: reviews, secure messaging and account protection, risk scoring, secure payments, watchlist and background checks, cleanliness standards, fraud and scam prevention, insurance and protections, age restrictions, an urgent safety line, a 24/7 neighborhood support line, and our guest refund policy. We deploy some of these features such as reviews and secure payments globally, and others such as background checks in specific countries and regions.
The platform seems to be highly engaging, with 68% of guests left reviews of their stays in 2019, and hosts and guests cumulatively have written more than 430 million reviews.
1.2 Sector and Industry Trends
Travel industry is definitely in penalty box right now as one of the industries that have been disproportionately negatively affected by COVID-19. A lot of hotels and resorts are seeing historical low occupancy rates and struggling with bankruptcies.
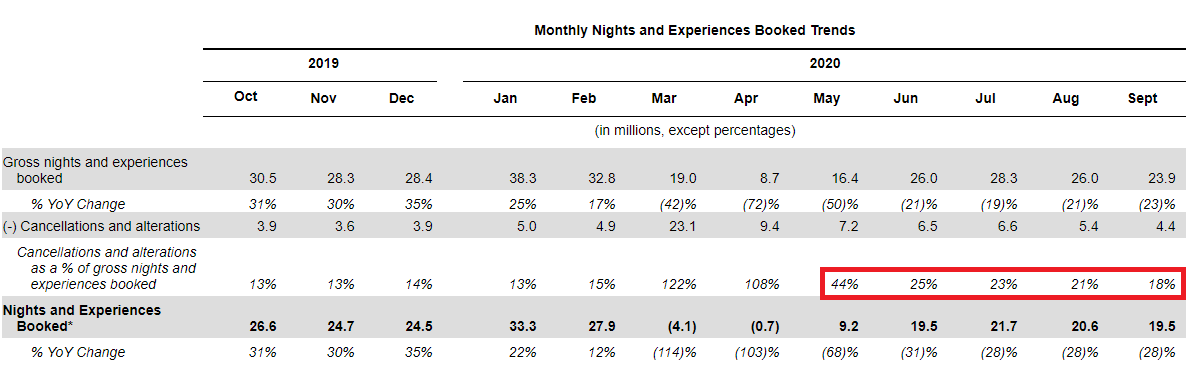
In Airbnb case, there isn’t a strict definition of occupancy rate but the hosts and guest activities have been greatly reduced since March this year. Gross nights and experiences booked were down 42% in March and 72% in April YoY. According to the latest data on September, the gross nights and experiences booked were still down 23% YoY. As a result Airbnb has been reducing operating costs significantly throughout the year, including a 25% reduction in employee headcount.
With more and more positive vaccine news coming out in recent weeks, travel industry as a group has seen strong outperformance in the stock market. Airbnb has also seen strong business rebounding as I will discuss more in the growth section. Airbnb has selected an interesting timing to go public. Although its business has been severely impacted by the pandemic, as we are approaching may be the ending phase of the pandemic together with its unique proposition in travel industry, Airbnb’s IPO may be surprisingly successful and may see a strong recovery uptrend in the next year.
1.3 Asset Light or Asset Heavy Business?
Airbnb is an asset light business. It does not own the properties of hosts. Its business model is to charge both host and guest a small amount of fee as revenue on every stay.
2. Growth
Past and future growth trends are discussed in this section especially the recent growth setback caused by COVID-19.
2.1 Growth Strategies
Not surprising, the natural way for Airbnb to go forward is to add more hosts, expand in the countries that it does not have deep penetrations yet, and iterate and evolve its products to appeal more guests. Airbnb emphasizes engaging community significantly as its core values so I can imagine it will continue to invest the growth of the services to improve its review and feedback system, host protection, and 24/7 support.
2.2 Penetration of TAM
Total addressable market for Airbnb is huge. Even after 13 years I believe it is still in early innings of this business. However, because of the global environment it operates in and the nature of the business involves people’s movements, there are regulations and geographical policies that Airbnb has to follow. It has not been a significant headwind so far but it could be factor in the future to affect the availability of rental properties and Airbnb’s ability to tap into the whole TAM.
Airbnb’s current SAM (Serviceable Addressable Market) – this is the market that it already has services but not fully expanded into – is about $1.5 trillion in total, including $1.2 trillion for short-term stays and $239 billion for experience.
TAM (Total Addressable Market) is estimated to be $3.4 trillion total including $1.8 trillion of short-term stays, $210 billion for long-term stays, and $1.4 trillion for experiences.
Note Airbnb does not list the long-term stays in its SAM, just to be conservative. What I saw during the pandemic, more and more people went to suburbs and rent houses for longer than 28 days (definition of long-term stay). 14% of nights booked in 2019 and 24% for the nine months ended September 30, 2020 were for long-term stays. It is definitely a growing trend.
Airbnb’s GBV (Gross Booking Value) in 2019 was $38 billions, a tiny portion of its SAM and TAM. So, still in very early innings.
2.3 High Growth, or Steward, or Low Growth Business?
Airbnb is a high growth business. In 2019, GBV grew 29% and revenue grew 32% over 2018. However Airbnb has noticeable slowdown in its annual revenue:
| Year | 2015 | 2016 | 2017 | 2018 | 2019 |
| Rev ($M) | 919 | 1656 | 2562 | 3652 | 4805 |
| Growth (%) | – | 80% | 55% | 43% | 32% |
As mentioned earlier, Airbnb has seen sharp drop in gross nights and experiences booked, resulting in drop in GBV as well. The first nine months revenue in 2020 has negative growth of -32%. One thing to notice is that the gross daily rate has been steadily increasing over the past year due to a couple of reasons:
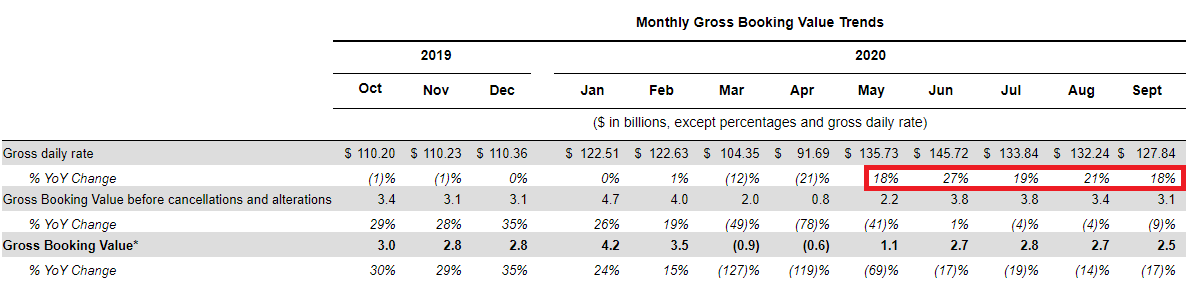
- Historically higher rates areas see faster recovery like North America and Europe.
- A shift towards more non-urban destinations with higher rates.
- General increase of rates due to global money printings.
If the last two of the above three reasons stand, and if vaccines can help recover the gross nights and experiences booked to a close to pre-pandemic level in 2021, Airbnb will be a strong beneficiary with sharp upwards revenue growth.
Another trend to notice is that the cancellations and alterations rate stay substantially high after Apr, averaging at 20%+ level compared to only 10%+ level last year. People are eager to get out but are still very concerned about the pandemic. This is another sign that the revenue will rebound fiercely once everything is settled down.
2.4 Are There Continuous Investments in R&D?
Yes. The products development investments up until 2019 and has outpaced the growth of revenue. It is a positive sign that the company focuses on innovation and is willing to spend ahead to incur more revenue growth in the future. The first nine months product development expense only dips about 0.5% compared to 2019, way outpacing the -32% drop in revenue. Even in a tough situation like this Airbnb still keeps up with product innovation.
| Year | 2015 | 2016 | 2017 | 2018 | 2019 |
| R&D ($M) | 100 | 228 | 401 | 579 | 977 |
| Growth (%) | – | 128% | 76% | 44% | 69% |
2.5 Revenue Growth vs. Expense Growth
Now let’s take a look at the sales and marketing cost as well as the total expense. S&M growth was below revenue growth until 2019. The same thing for total expense where Airbnb controlled very well till 2018 and 2019 had a bump, too. Combined with the 69% hike of R&D cost in section 2.4 we can see that 2019 was a big spending year for Airbnb, probably intended to re-ignite the growth to prepare for a hyped 2020 IPO event.
Airbnb’s perfect plan was unfortunately interrupted by COVID-19. The first nine months S&M expense has dropped 54% and Total Expense has dropped 26% (excluding restructuring cost, and outpacing the revenue drop 32%).
| Year | 2015 | 2016 | 2017 | 2018 | 2019 |
| Sales and Marketing ($M) | 397 | 663 | 872 | 1101 | 1622 |
| S&M Growth (%) | – | 67% | 32% | 26% | 47% |
| Total Expense ($M) | 1043 | 1789 | 2643 | 3633 | 5307 |
| TE Growth (%) | – | 72% | 48% | 37% | 46% |
2.6 Competitive Advantage
The competitive advantage is important for a business to maintain consistent high growth. In Airbnb’s case, its growth has slowed down due to scale so the company had to spend big to keep growth. Given the huge SAM and TAM and low penetration estimated by Airbnb, the growth slow down was not impressive.
There are other online travel services that can intensify the competition in this specific field. But remember the core of host/guest rental model is the trust system and the community that Airbnb strives to build in the past thirteen years.
Overall Airbnb does have enough moat to guard itself from competition, but it still has to prove itself on the consistent growth side in a post-pandemic world.
3. Profitability
3.1 Growth Margin > 50%?
A business can be considers as high margin if its gross margin is greater than 50%. Airbnb has kept steady gross margins for years and the first nine months of 2020 is slightly lower at 74%. Nothing to frown upon.
| Year | 2015 | 2016 | 2017 | 2018 | 2019 |
| Revenue ($M) | 919 | 1656 | 2562 | 3652 | 4805 |
| Gross Profit ($M) | 692 | 1242 | 1914 | 2787 | 3609 |
| Gross Margin (%) | 75.3% | 75.0% | 74.7% | 76.3% | 75.1% |
3.2 EBITDA Positive or EPS Positive?
Airbnb uses so called Adjusted EBITDA to gauge profitability. The major difference of adjusted EBITDA from traditional EBITDA is the stock-based compensation expense. I am always a little bit suspicious about anything that has “adjusted” in front of it. However even under the adjusted-EBITDA Airbnb was not positive in every year. Net income has always been negative.
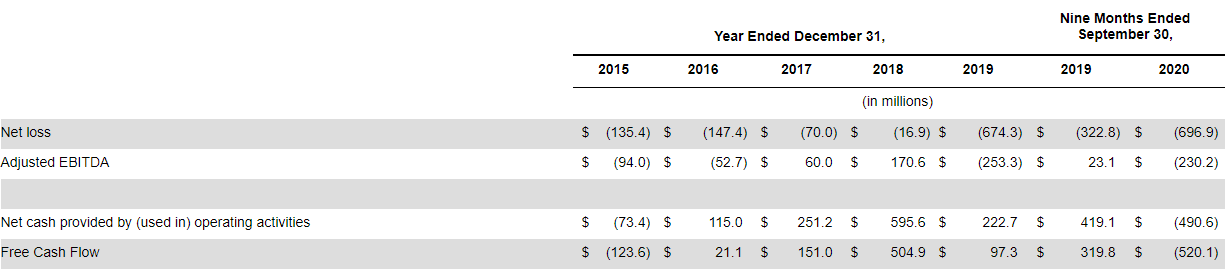
3.3 Operating Cash Flow Positive?
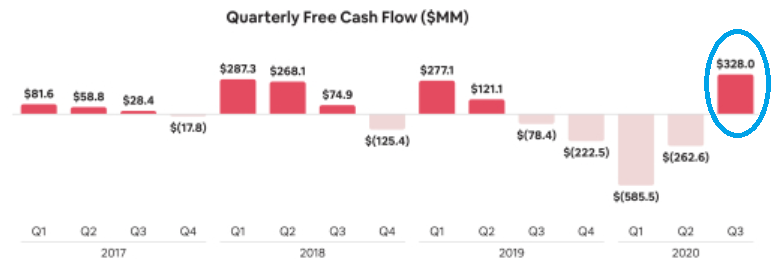
When a business is not EPS positive nor EBITDA positive, we look into CFO (Cash Flow From Operations) and FCF (Free Cash Flow) and hope they are at least positive. From the picture in section 3.2, it is true that Airbnb was CFO & FCF positive from 2016 to 2019. Its adjusted EBITDA and CFO/FFO peaked in 2018, confirming 2019 was a big spending year and 2020 was simply disastrous. The company had turned around in Q3 and started to generate FCF again:
3.4 Rule of 40?
Nope. At lease not consistently. I use revenue growth plus the typical EBITDA margin for the rule of 40 equation. Airbnb’s traditional EBITDA if includes the stock-compensation expense is quite negative, plus the recent years the revenue growth slid below 40%. It is far away from 40%. Company that can consistently satisfy rule of 40 (5 years) is extremely rare and that would trigger a very strong buy condition.
4. Debt and Liquidity
4.1 LTM Debt vs. Equity Ratio
For IPO stock I would rather revisit this when the first quarterly report is out and the fund from IPO is included in the balance sheet.
4.2 Can Short Term Liquidity Cover Long Term Debts?
It is a strong sign the company is in good shape in terms of solvency in at least couple of years if the answer is yes. Airbnb’s answer is yes. It has $2.6 billion of cash and $1.8 billion in marketable securities as of September 2020, more than enough to cover the long-term debt of $1.8 billion.
4.3 Interest Coverage
The interest expense of Airbnb was historically low with its highest interest expense $26M in 2018. The adjusted-EBITDA could easily cover it many multiples when it was positive. Again 2020 was a disastrous year, with interest expense spiked to over $100M in the first nine months and very negative adjusted-EBITDA. But as we see in section 4.2, Airbnb’s cash position is sufficient enough to cover the whole long term debt.
4.4 Debt Level Increase or Decrease
Increase. In April 2020 the company entered into two loans, each worth $1.0 billion and due in 2025. The interest rate is not low, as you can see from this years over $100M interest. Although I am not an expert on reading debt terms, a quick glance indicating both loans at least have interest basis at 5-7% plus a floating portion. So Airbnb did not enter those loans to take advantage of the lower interest rate environment but to prepare for the worst scenario. Note it was the first time Airbnb had raised such big amount of long-term debts since 2015. This over $100M interest per year is going to be a drag on profitability and hopefully when the situation turns around, management can pay those loans off as soon as possible.
5. Reasons to Buy or Not to Buy
5.1 Reasons to Buy
- Founders led
- Early inning in a huge SAM and TAM
- A very specific type of travel business with moat building over 13 years (trust system and review system and community)
- Revenue in most years grew faster than total expense, indicating a likely path to eventual profitability
- Willing to invest heavily on R&D even during pandemic.
- Although hit hard by pandemic, Airbnb is well positioned for a fierce comeback when this is all over. It reduced costs, raised debts, now is raising IPO money – it has the ability to spend big and capitalize on the growth trend again with vaccines distributed.
5.2 Reasons Not to Buy
- Growth has been slowing down before pandemic. Even post pandemic, Airbnb still needs to prove itself that the growth can be re-accelerated. It definitely requires big spending, but to what extent and how much profit will be left.
- Competitions from other online travel platforms (which I doubt will cause material impact to Airbnb given its strong moat).
- Pandemic lasts longer than expected, i.e. ineffective vaccines.
6. KPI to Monitor
A few things to investigate in the next few quarters of Airbnb following its IPO:
- Typical metrics of a growth company: Rev growth and expense growth, etc. Can Airbnb go back to FCF positive?
- Gross nights and experiences booked and gross booking value trend: increase or decrease YoY, does it recover to close to pre-pandemic level
- Trend of specific types of stays. Airbnb specifically said that domestic travels, short distance travels and long-term travels have rebound strongly since April and long-term travels have even crossed over pre-pandemic level. It is interesting to see when international travels recover, what will happen to other types of stays. Will they keep the current rebounding trends or split some nights to international travels.
- Gross daily rate of stay: Ideally see it continues to increase post pandemic.
- Usage of IPO funds. If management uses the funds to greatly reduce debts, then they are confident the pandemic is behind us. If they are still hoarding cash, things could get worse even though you may not see it coming.
Disclaimer: The information contained on this site is provided with author’s personal opinions and is not for recommendations or solicitations of investments. Readers should consult professional advisors for more complete and current information to make investment decisions.